
Preventing Global Warming(2023)
Principal Initiatives in Fiscal Year 2023
01Energy Consumption and CO2 Emissions by the Global DIC Group (Scope 1 and 2)
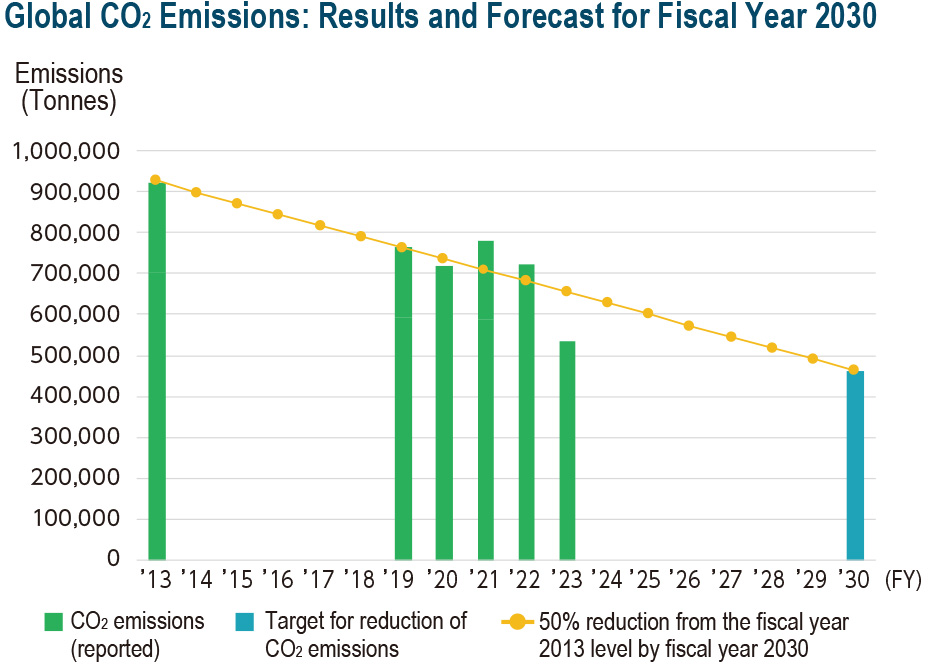
Energy consumption by the global DIC Group in fiscal year 2023 amounted to 12,799,823 GJ, while CO2 emissions totaled 534,889 tonnes. CO2 emissions per unit of production were 233.0 kg/tonne. The Group achieved its target for reducing its consumption and CO2 emissions were down from fiscal year 2022, owing to the expanded use of green power in Japan and a switch from a coal-fired to a low-carbon LNG-fired boiler at the Karawang Plant in Indonesia. These results also reflect the promotion of more ambitious energy-saving and decarbonization initiatives, including the adoption of internal carbon pricing.
The DIC Group continues to implement a variety of energysaving measures, including introducing highly efficient facilities, promoting process improvements and boosting capacity utilization rates, while at the same time further advancing its use of renewable energy by shifting to biomass and other clean fuels and installing solar power facilities. Some of these initiatives are outlined below.
In addition, the Sustainability Committee has made the decision to adopt CO2-free electric power at all DIC Group sites in Japan. In November 2022, the DIC Building (DIC’s corporate headquarters) and the No. 2 DIC Building in Tokyo switched fully to CO2-free purchased electric power. Remaining sites began gradually changing over in April 2023, with a total of 34 sites having completed this switch. Looking ahead, the Group will also advance the use of green power at sites in other countries and territories. The Group has obtained third-party verification of its CO2 emissions (Scope 1 and 2).
| Factors | Impact on CO2 emissions (tonnes) | Decrease (%) | ||
|---|---|---|---|---|
DIC Group in Japan |
Implementation of 473 energy-saving initiatives at sites | -62,533 | -71,820 | 10.0 |
| Reduction of emissions factor for electric power | -6,373 | |||
| Decrease in production volume | -2,914 | |||
DIC Group in other countries and territories |
Asia–Pacific region: Switch from coal-fired to LNG-fired boiler in Indonesia | -22,695 | -44,269 | 15.8 |
| Asia–Pacific region: Power purchase agreement (PPA) in India | -1,407 | |||
| Asia–Pacific region: Shift to green power | -2,021 | |||
| Asia–Pacific region: Energy-saving initiatives at sites | -1,872 | |||
| Asia–Pacific region: Decrease in production volume | -13,548 | |||
| Asia–Pacific region: Other factors (including reconstruction of facilities) | -2,725 | |||
| Greater China: Energy-saving initiatives at sites | -2,708 | 9,541 | ||
| Greater China: Acquisition of business | 7,770 | |||
| Greater China: Increase in production volume | 2,693 | |||
| Greater China: Other factors (including installation of new equipment) | 1,786 | |||
| Sun Chemical Group: Decrease in productio | -78,764 | -78,764 | ||
| Other: Decrease in production volume | -244 | -244 | 25.8 | |
| Change in CO2 emissions (tonnes) | -185,555 | |||
| Global CO2 emissions in fiscal year 2022 | 720,444 | |||
| Global CO2 emissions in fiscal year 2023 | 534,889 | |||
Regional Initiatives
Japan
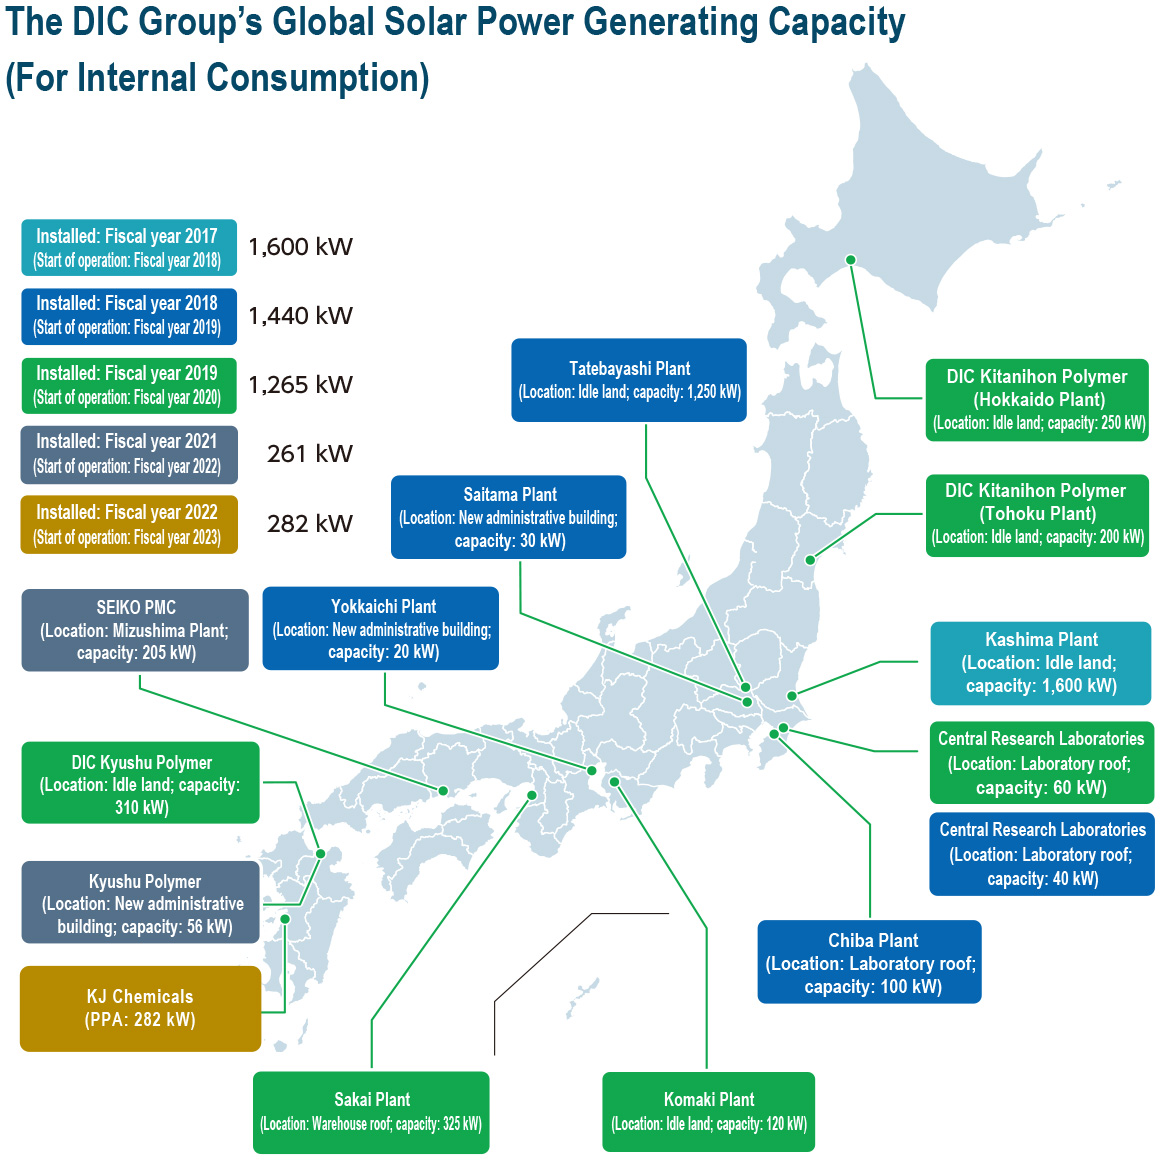
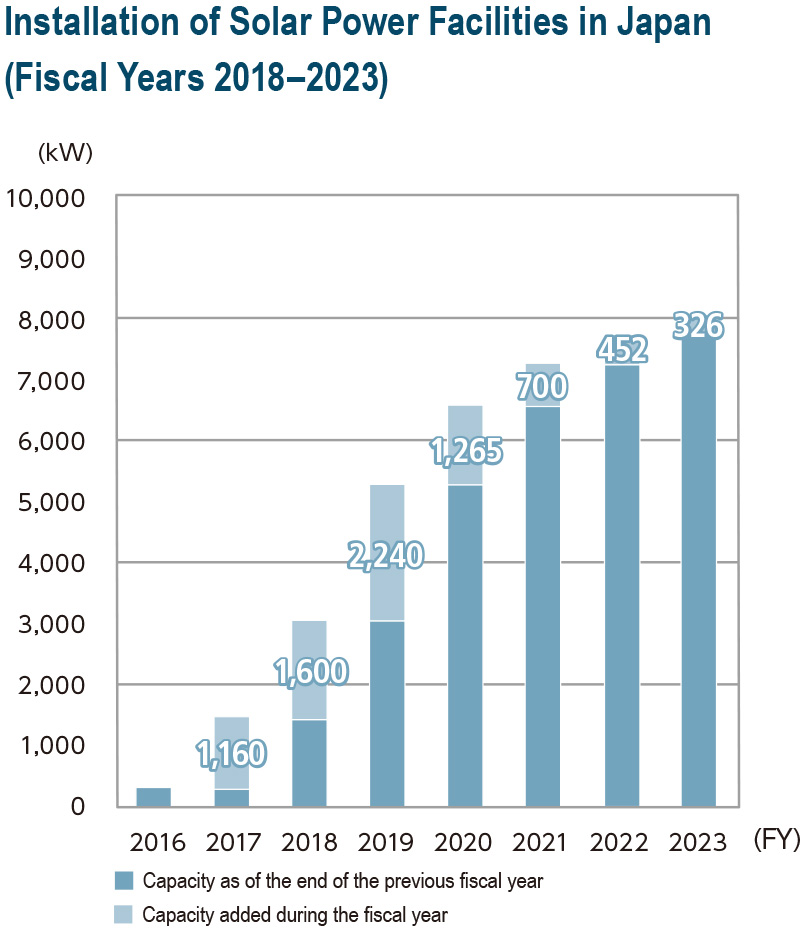
The bulk of renewable energy used by DIC Group companies in Japan is natural energy generated by a biomass boiler, as well as the use of wind and solar power (including through power purchase agreements PPAs.) In fiscal year 2023, the DIC Group in Japan used 549,000 GJ of renewable energy (equivalent to 14,171 kl of crude oil), or 12.4% of total energy (steam and electric power) used by these companies. The use of renewable energy by DIC Group companies in Japan in fiscal year 2023 accounted for a reduction in CO2 emissions of 38,069 tonnes, equivalent to 21.8% of the total reduction achieved by the Group in Japan.
Total energy consumption by the DIC Group’s 20 offices and research sites (excluding the Central Research Laboratories) in Japan in the period under review was down 1.6% from the previous fiscal year. A key factor behind this decrease was the implementation of energy-saving initiatives by these facilities, including replacing aged light fixtures and air conditioning equipment with newer high-efficiency models that comply with the standards set by the Energy Conservation Center, Japan (ECCJ) for its Top Runner program; turning off lights when not needed and implementing mandatory air conditioning temperature settings; and working with facility management companies to promote diligent measures to reduce energy use. In addition, a year-round no-jacket/no-tie dress code was instituted under the WSR 2020 project.
The use of electric power generated using energy from renewable sources at an additional 33 sites had a significant positive impact on CO2 emissions by the DIC Group, which were down 100,601 tonnes, or 34.5%, from fiscal year 2022. Looking ahead, the Group will continue taking decisive steps to advance its use of renewable energy with the aim of meeting the goals of DIC NET ZERO 2050.
Europe
In an investment aimed at helping ensure sustainability by reducing greenhouse gas emissions, Sun Chemical’s plant in Vienna replaced two older steam-generating boilers with smaller, more efficient units. The integration of the new boilers into the plant’s existing heat recovery infrastructure resulted in a decrease in CO2 emissions of 300 tonnes. Other initiatives to reduce CO2 emissions include projects to improve energy efficiency that have helped curb environmental impact and lower costs. Sun Chemical will continue to focus on the recovery and reuse of waste heat as a particularly effective approach at many of its facilities.
Asia–Pacific Region
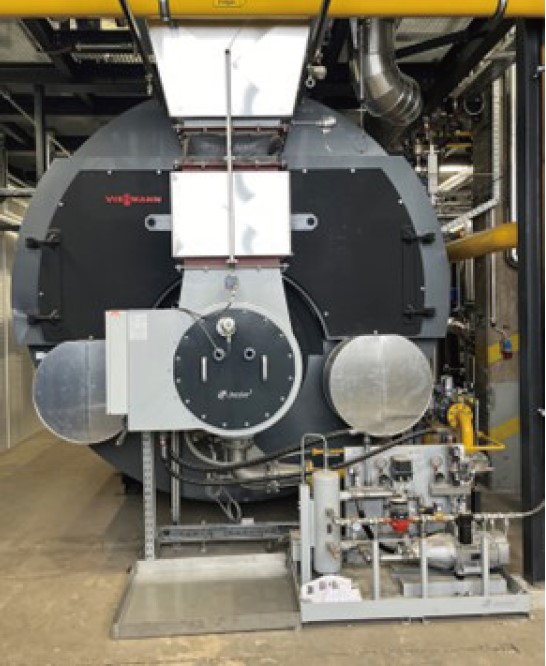
The coal-fired boiler at PT. DIC Graphics’ Karawang Plant in Indonesia was replaced with a low-carbon LNG-fired unit. The lower carbon content of the fuel used to fire this boiler contributed significantly to a decline in regional CO2 emissions. The plant also has a biomass boiler fueled partially by palm kernel shells.
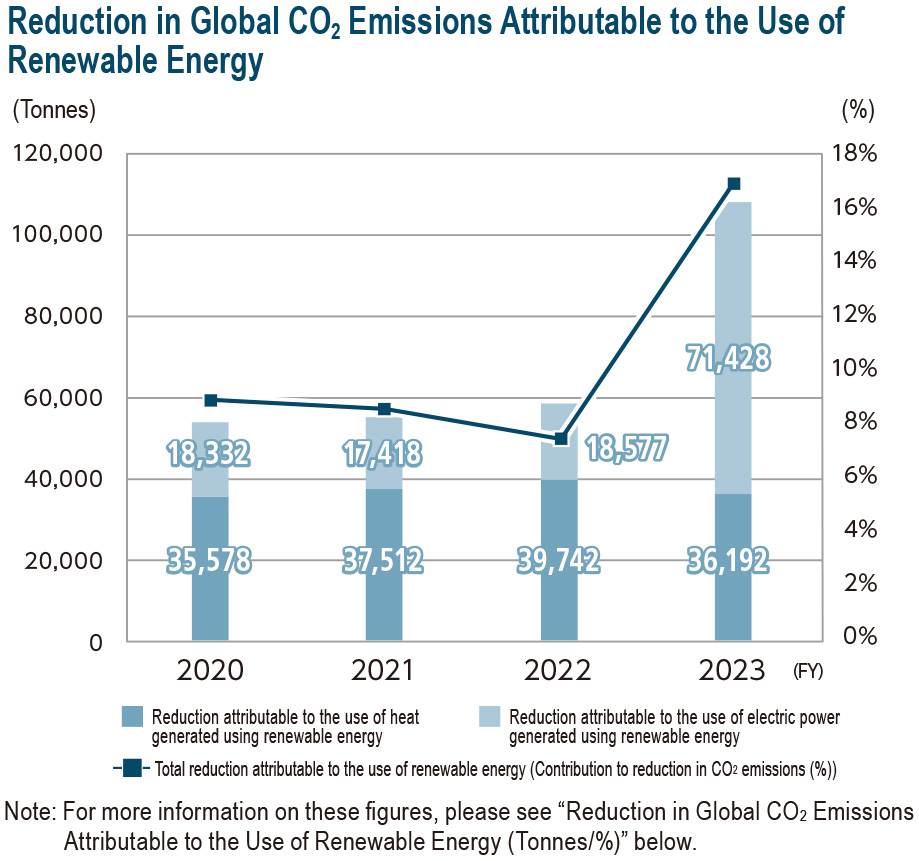
Reduction in Global CO2 Emissions Attributable to the Use of Renewable Energy
| Unit | 2020 | 2021 | 2022 | 2023 | |
|---|---|---|---|---|---|
| Reduction attributable to the use of heat generated using renewable energy (biomass) | t-CO2 | 35,578 | 37,512 | 39,742 | 36,192 |
| Reduction attributable to the use of renewable energy (electric power generated on-site) | t-CO2 | 18,332 | 17,418 | 12,568 | 6,874 |
| Reduction attributable to the use of (green power) | t-CO2 | 0 | 0 | 6,009 | 64,554 |
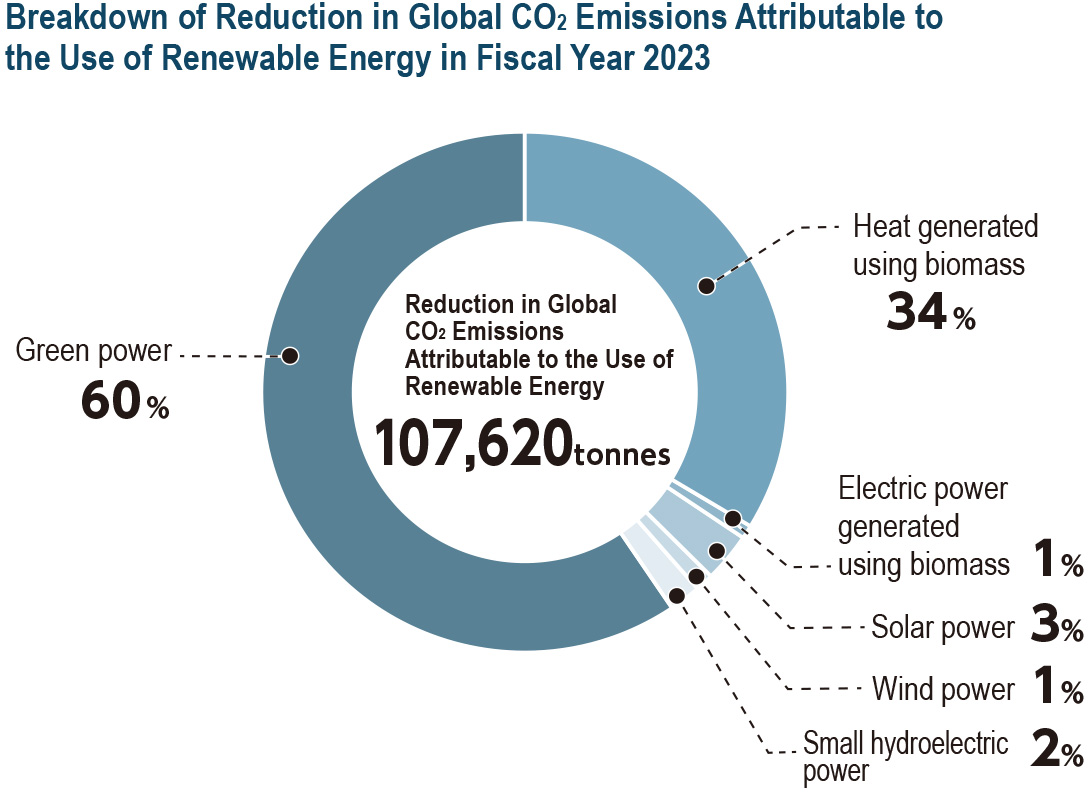
| Total reduction attributable to the use of renewable energy | t-CO2 | 53,909 | 54,929 | 58,319 | 107,620 |
| CO2 emissions by the global DIC Group | t-CO2 | 551,049 | 588,985 | 720,444 | 534,889 |
| Total reduction attributable to the use of renewable energy + CO2 emissions by the global DIC Group | t-CO2 | 604,959 | 643,914 | 778,763 | 642,509 |
| Total reduction attributable to the use of renewable energy (%) | % | 8.9% | 8.5% | 7.5% | 16.7% |
| Reduction attributable to the use of electric power generated using renewable energy (biomass) | t-CO2 | 7,739 | 6,542 | 7,277 | 1,100 |
| Reduction attributable to the use of solar power | t-CO2 | 8,165 | 8,054 | 2,320 | 3,072 |
| Reduction attributable to the use of wind power | t-CO2 | 2,025 | 2,451 | 2,683 | 928 |
| Reduction attributable to the use of small hydroelectric power | t-CO2 | 403 | 371 | 288 | 1,774 |
| Reduction attributable to the use of renewable energy (electric power generated on-site) | t-CO2 | 18,332 | 17,418 | 12,568 | 6,874 |
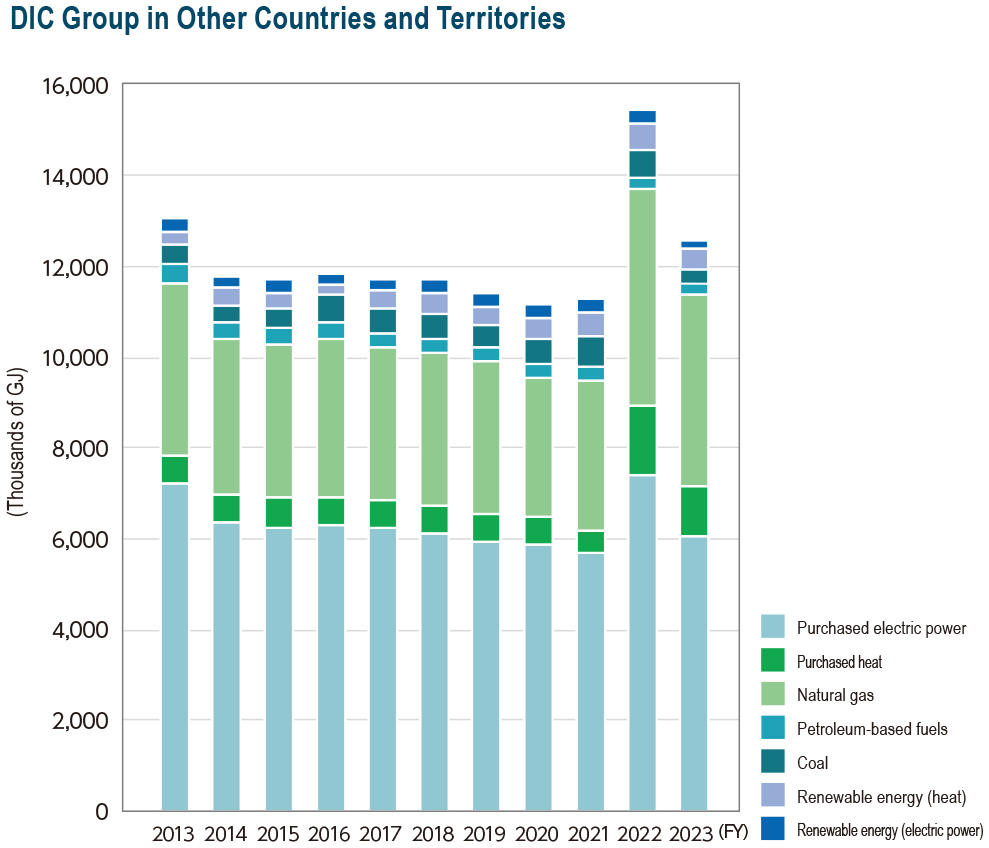
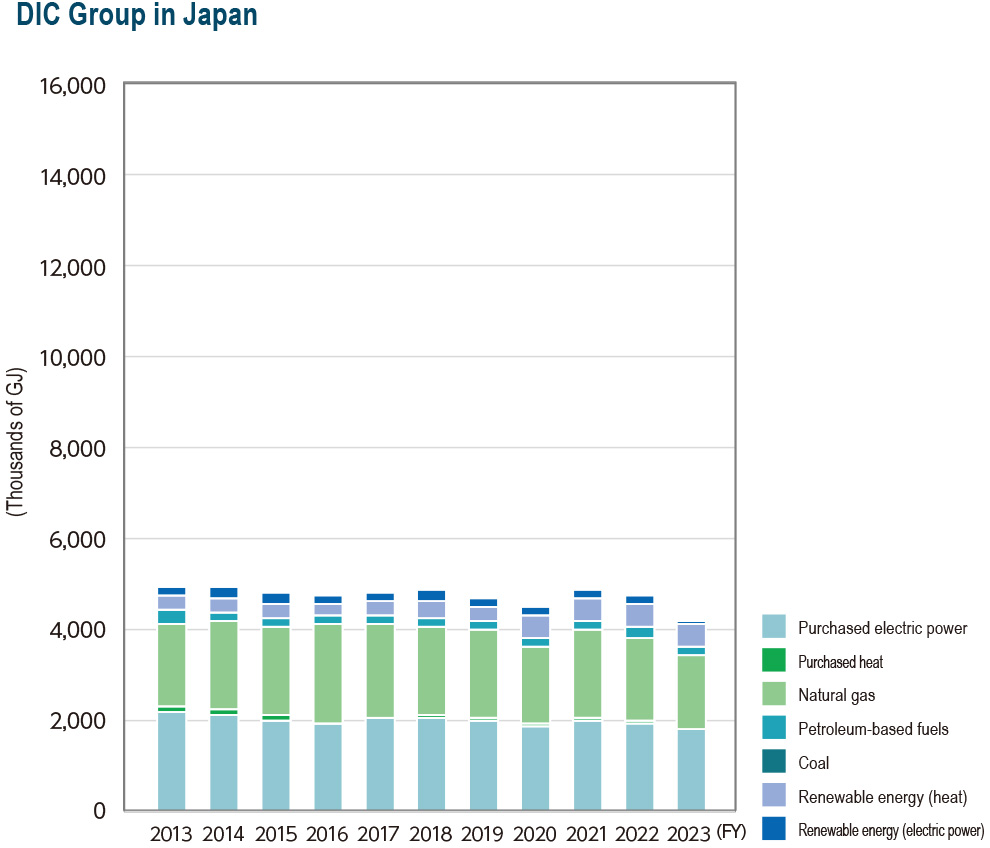
Energy Mix
02Grasping CO2 Emissions Across the DIC Group’s Supply Chains (Scope 3)
The DIC Group recognizes the importance of reducing emissions of greenhouse gases across its supply chains and works to ensure a grasp of emissions in all categories of Scope 3. The Group has also revised its calculation for emissions in all categories with the aim of refining data reported in this category.
| Category number | Category | Emissions |
|---|---|---|
| 1 | Purchased goods and services | 4,658,043 |
| 2 | Capital goods | 164,043 |
| 3 | Fuel- and energy-related activities (not included in Scope 1 or 2) |
136,579 |
| 4 | Upstream transportation and distribution | 259,542 |
| 5 | Waste generated in operations | 69,692 |
| 6 | Business travel | 2,893 |
| 7 | Employee commuting | 6,825 |
| 9 | Downstream transportation and distribution | 308 |
| 10 | Processing of sold products | 144,565 |
| 12 | End-of-life treatment of sold products | 1,268,613 |
| 15 | Investments | 17,626 |
Procurement Initiatives
ased on the DIC Group Sustainable Procurement Guidelines, DIC formulated and promotes awareness of the DIC Group Sustainable Procurement Guidebook, encouraging suppliers to reduce their emissions of greenhouse gases. The Group also surveys suppliers to assess the status of their emissions reduction efforts and their reduction targets, and to enhance understanding. With the objective of better grasping and lowering the carbon footprint of DIC products, the Group is also making provisional calculations of the carbon footprint of the raw materials it uses, as well as seeking to expand its used of bioderived and recycled raw materials. (For more information, please see “Ensuring the Sustainable Procurement and Use of Raw Materials” in “Sustainable Procurement”.)
Logistics Initiatives
In Japan, DIC Group companies are using fewer, larger trucks and taking decisive steps to improve loading efficiency, as well as promoting the use of modal shift and the efficient combination of truck, rail and marine transport. Group companies in other countries and territories are advancing initiatives tailored to local circumstances. Over the long term, the Group will explore diversifying the transportation methods it uses with a view to reducing emissions of greenhouse gases by advancing the use of next-generation modes of transport.
Calculating PCF
To achieve carbon neutrality, it is crucial to reduce CO2 emissions across the supply chain. To this end, it is necessary to calculate and reduce the CO2 emissions of each DIC Group company and product. Despite the existence of international standards for calculating product carbon footprint (PCF), including those provided by ISO 14067:2018 and the GHG Protocol, certain aspects of these standards are vague, so companies trying to calculate PCF must make their own interpretations and determine their own specific method for calculation. The DIC Group has shared information, including on guidelines from the European nonprofit Together for Sustainability (TfS) and Japan’s Ministry of Economy, Trade and Industry and Ministry of the Environment, to develop a consistent Groupwide method for calculating PCF. In fiscal year 2023, the DIC Group calculated PCF for 1,809 products (DIC: 179, Sun Chemical: 1,630) and provided this information to customers.
Avoided Emissions
The term “avoided emissions” refers to CO2 emissions that can be avoided through the use of a product. Examples include products that contribute to improving fuel efficiency by reducing vehicle body weight and products that help reduce energy used for heating and cooling by improving insulation. In recent years, avoided emissions have attracted attention as a way to envisage the positive impact of corporate activities on climate change. While there remains room for improvement in terms of the precision of calculation methods and the reliability of calculations, DIC is promoting the use of avoided emissions as a way for it to clarify its contributions to decarbonization across its supply chains.
Innovation
By capitalizing on open innovation to promote the chemical recycling of its products, as well as the recycling and conversion of recovered CO2 into new raw materials, the DIC Group is working to realize manufacturing that does not rely on fossil fuels, thereby helping contribute to sustainability for the global environment and for society, as set forth in DIC Vision 2030.
Protecting the Ozone Layer
Hydrofluorocarbons (HFCs) are used widely as refrigerants in equipment and facilities. While not an ozone-depleting substance, HFCs have a warming potential 100–10,000 times that of CO2 and their use is expected to account for a 0.5°C increase in the global average temperature by the end of the 21st century. At the 28th Meeting of the Parties in Kigali, Rwanda, held in October 2016, the Parties to the Montreal Protocol on Substances that Deplete the Ozone Layer reached an agreement to phase out the production and use of HFCs (the Kigali Amendment). As of January 11, 2024, the Kigali Amendment had been ratified by 156 Parties, including Japan.
In April 2015, Japan revised its Fluorocarbons Recovery and Destruction Law. The same month, the Act on Rational Use and Proper Management of Fluorocarbons entered into force, compelling stakeholders to ascertain and report leaks of fluorocarbons from commercial equipment and facilities. In April 2020, a revised version of the Act on the Rational Use and Proper Management of Fluorocarbons came into effect, introducing direct penalties for violations in instances where fluorocarbons are not recovered by users.
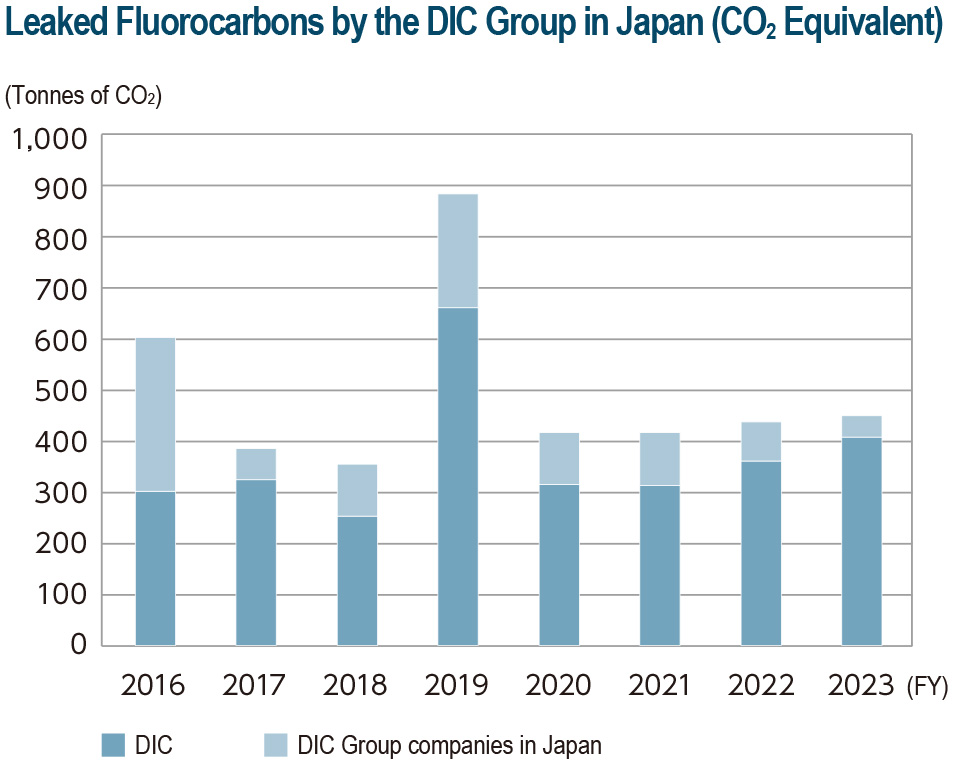
In fiscal year 2023, leaked fluorocarbons from DIC Group sites in Japan were equivalent to 452 tonnes of CO2. (Leaks in excess of 1,000 tonnes per site or per company must be reported to the Japanese authorities.) The Company has worked to effectively manage fluorocarbons since fiscal year 2015, when the Act on Rational Use and Proper Management of Fluorocarbons entered into force, and has managed to keep leaks below the level requiring reporting. In fiscal year 2023, the Group’s efforts to comply with laws governing leaked fluorocarbons were recognized in the Japan Refrigerant and Environmental Organization’s third JRECO Fluorocarbon Rating. DIC has earned an A rank every year since this program began.
Going forward, the DIC Group will continue working to ensure compliance with pertinent laws and regulations, as well as to reduce leaked fluorocarbons from its sites by, among others, choosing air conditioning equipment with low environmental impact refrigerants, including those containing no fluorocarbons.
Key Data
| Category | Unit | Boundary | Fiscal year 2019 | Fiscal year 2020 | Fiscal year 2021 | Fiscal year 2022 | Fiscal year 2023 |
|---|---|---|---|---|---|---|---|
| Energy used (converted into GJ) |
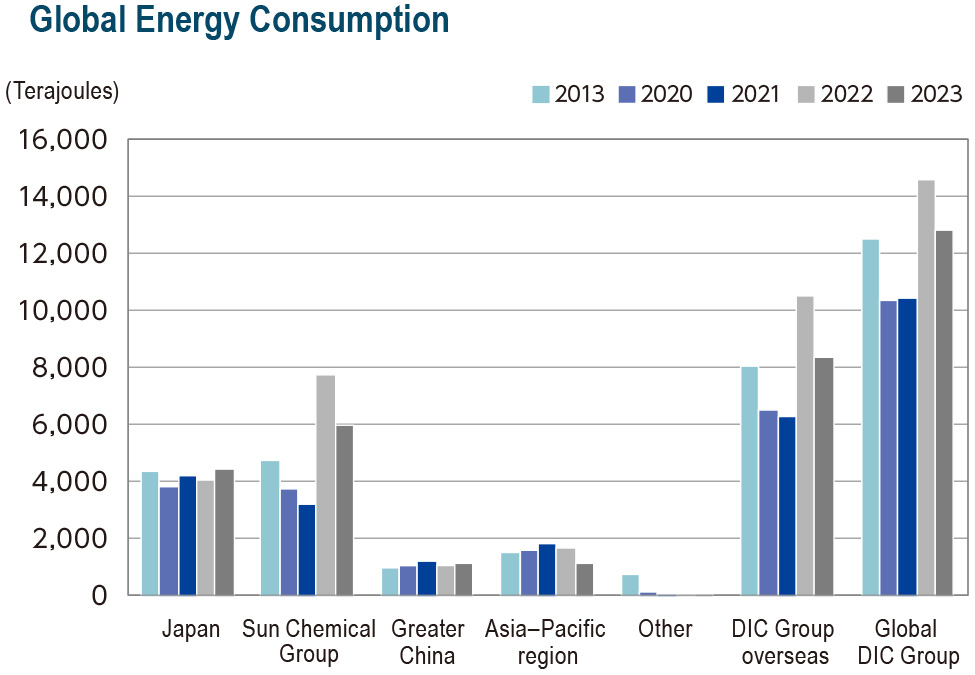
1,000 GJ | Japan | 4,184 | 3,827 | 4,183 | 4,028 | 4,447 |
| PRC | 1,056 | 1,036 | 1,197 | 1,066 | 1,110 | ||
| Asia–Pacific region | 1,623 | 1,606 | 1,835 | 1,650 | 1,178 | ||
| Sun Chemical | 3,784 | 3,791 | 3,196 | 7,767 | 6,017 | ||
| Other | 69 | 118 | 63 | 58 | 48 | ||
| Global | 10,717 | 10,379 | 10,474 | 14,569 | 12,800 | ||
| Energy consumed per unit of production |
GJ/tonne | Japan | 3.706 | 3.733 | 3.656 | 3.687 | 4.391 |
| PRC | 5.574 | 5.698 | 4.749 | 4.881 | 3.914 | ||
| Asia–Pacific region | 6.81 | 7.151 | 7.389 | 7.331 | 5.825 | ||
| Sun Chemical | 4.371 | 4.705 | 3.739 | 7.603 | 7.557 | ||
| Other | 133.44 | 3.03 | 108.223 | 110.776 | 102.07 | ||
| Global | 4.423 | 4.559 | 4.189 | 5.695 | 5.577 | ||
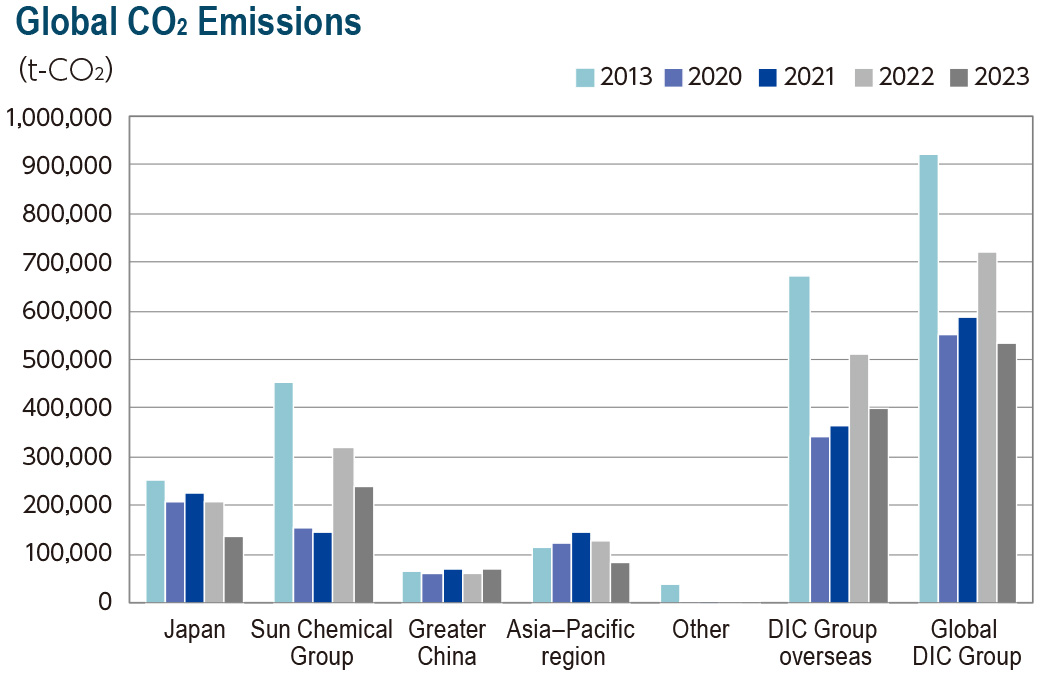
| CO2 emissions | Tonnes | Japan | 232,028 | 209,018 | 224,916 | 208,231 | 136,412 |
| PRC | 63,000 | 60,163 | 70,342 | 62,457 | 71,998 | ||
| Asia–Pacific region | 122,812 | 123,227 | 144,107 | 127,851 | 83,583 | ||
| Sun Chemical | 173,146 | 153,374 | 147,553 | 319,946 | 241,182 | ||
| Other | 2,107 | 5,267 | 2,068 | 1,958 | 1,715 | ||
| Global | 593,093 | 551,049 | 588,985 | 720,444 | 534,889 | ||
| CO2 emissions (Scope 1) | Tonnes | Japan | 135,428 | 118,786 | 135,612 | 128,458 | 112,591 |
| PRC | 14,004 | 13,098 | 15,287 | 14,635 | 22,896 | ||
| Asia–Pacific region | 66,199 | 69,597 | 88,575 | 76,127 | 44,028 | ||
| Sun Chemical | 53,780 | 50,283 | 51,503 | 121,361 | 97,600 | ||
| Other | 1,236 | 1,299 | 1,085 | 1,029 | 944 | ||
| Global | 270,647 | 253,064 | 292,063 | 341,610 | 278,059 | ||
| CO2 emissions (Scope 2) | Tonnes | Japan | 96,600 | 90,231 | 89,304 | 79,773 | 23,821 |
| PRC | 48,996 | 47,065 | 55,054 | 47,822 | 49,102 | ||
| Asia–Pacific region | 56,613 | 53,630 | 55,531 | 51,725 | 39,555 | ||
| Sun Chemical | 119,366 | 103,091 | 96,050 | 198,585 | 143,582 | ||
| Other | 871 | 3,967 | 982 | 929 | 771 | ||
| Global | 322,446 | 297,986 | 296,922 | 378,834 | 256,830 | ||
| CO2 emissions per unit of production |
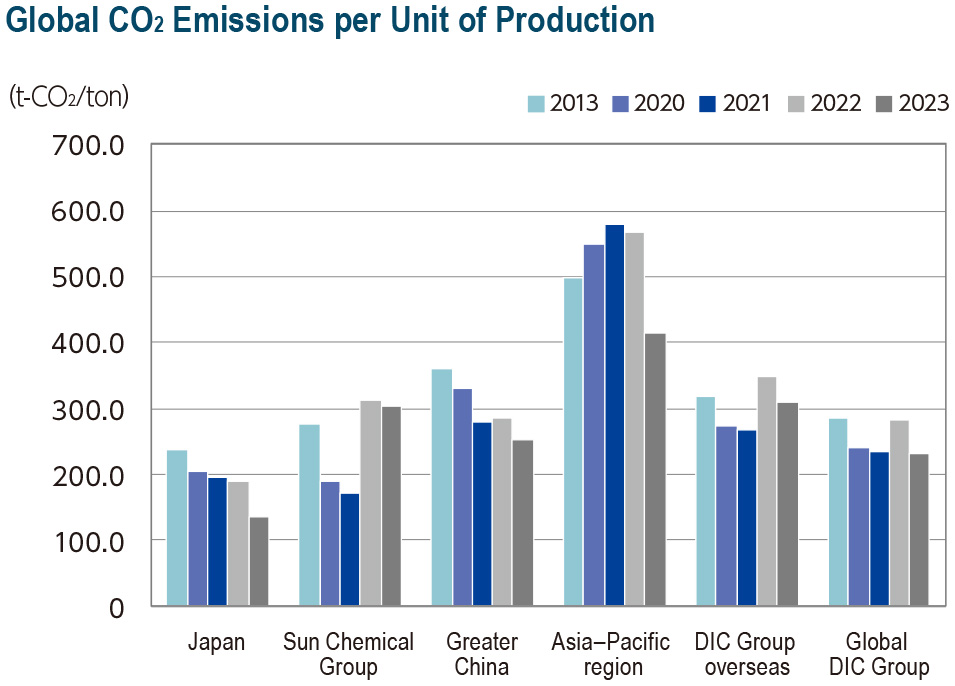
Kg/tonne | Japan | 206 | 204 | 197 | 191 | 135 |
| PRC | 332 | 331 | 279 | 286 | 254 | ||
| Asia–Pacific region | 515 | 549 | 580 | 568 | 413 | ||
| Sun Chemical | 200 | 190 | 173 | 313 | 303 | ||
| Other | 4,053 | 135 | 3,579 | 3,731 | 3,616 | ||
| Global | 245 | 242 | 236 | 282 | 233 |
-
Notes:
- The Colors & Effects pigments business is included in data from fiscal year 2022.
- Non-fossil fuels and renewable energy are included in energy from fiscal year 2023.
- Owing to rounding, some totals may differ from sums achieved by adding individual figures.
Back number
- Principal Initiatives in Fiscal Year 2023
- Principal Initiatives in Fiscal Year 2022
- Principal Initiatives in Fiscal Year 2021
- Principal Initiatives in Fiscal Year 2020
- Principal Initiatives in Fiscal Year 2019
- Principal Initiatives in Fiscal Year 2018
- Principal Initiatives in Fiscal Year 2017
- Principal Initiatives in Fiscal Year 2016
- Principal Initiatives in Fiscal Year 2015
- Principal Initiatives in Fiscal Year 2014
- Principal Initiatives in Fiscal Year 2013
