
ESG Data
S: Social data
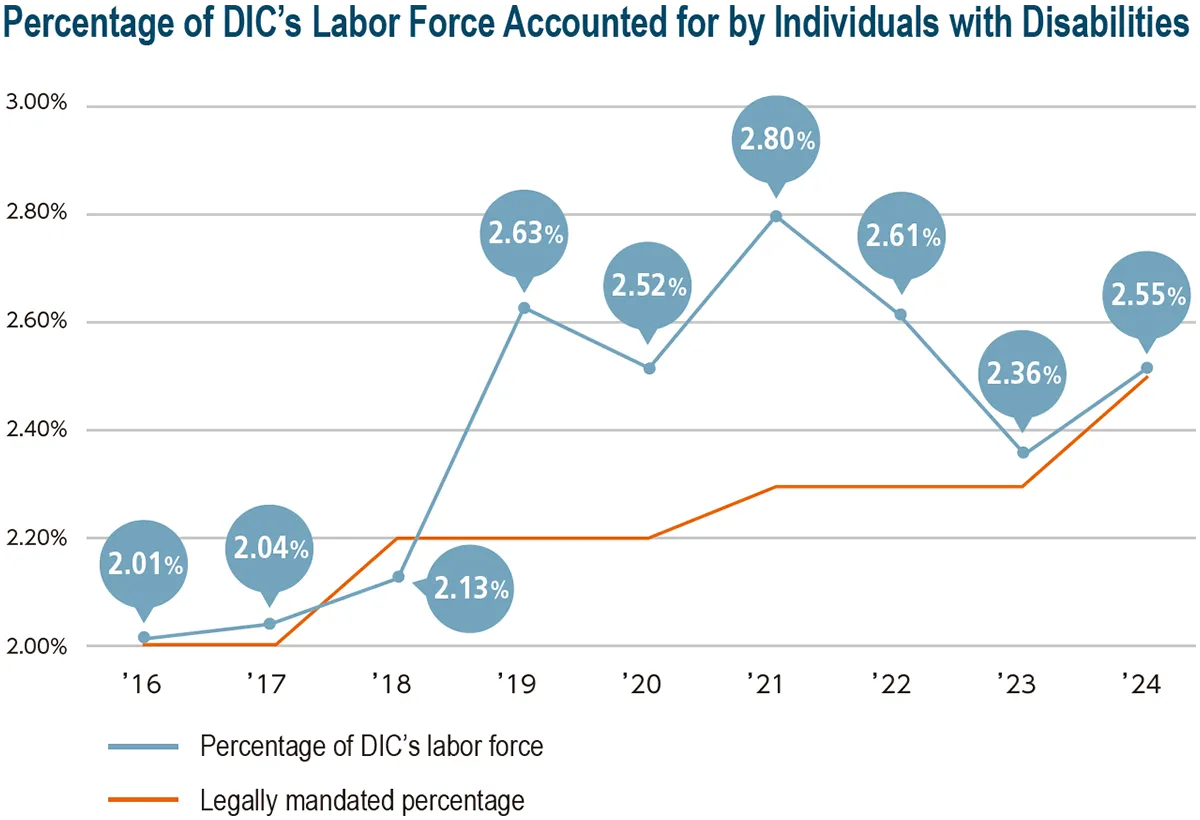
Percentage of DIC’s Labor Force Accounted for by Individuals with Disabilities
Average Spending on Education and Training per Employee (DIC)
| Region | Average time spent on education/training (hours/empcloyee) |
| Japan (DIC) | 9.1 |
| PRC | Up to 13 |
| Asia–Pacific region | 19.5 |
Diversity KPIs
| DIC | Targets (Fiscal year 2025) | Achievements | |||
|---|---|---|---|---|---|
| 1 | Percentage of directors and Audit & Supervisory Board members accounted for by women and/or foreign nationals | January 2026 |
20.0% | January 2025 |
21.4% |
| 2 | Percentage of executive officers accounted for by women and/or foreign nationals | 20.0% | 19.0% | ||
| 3 | Percentage of management positions occupied by women | 8.0% | 8.6% | ||
| 4 | Percentage of new employees accounted for by foreign nationals | Fiscal year 2025 |
5.0% | Fiscal year 2024 |
3.9% |
| 5 | Percentage of new recruits accounted for by women | Maintain at 30% | 26.3% | ||
| 6 | Percentage of mid-career hires accounted for by women | 30.0% | 18.3% | ||
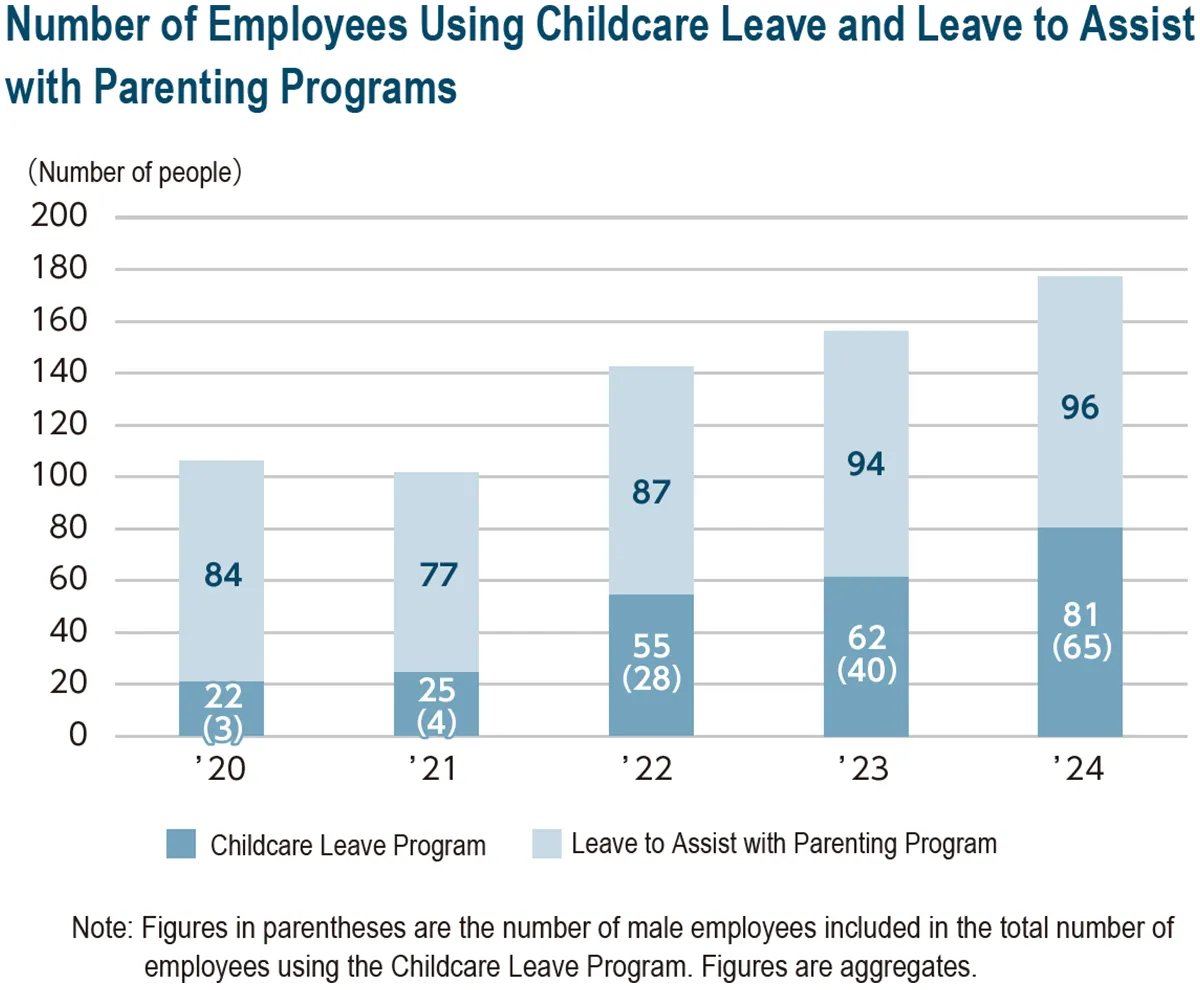
| 7 | Percentage of male employees using the Childcare Leave Program | 30.0% | 55.6% | ||
| 8 | Percentage of employees using the Leave to Assist with Parenting Program | 90.0% | 82.1% | ||
| 9 | Percentage of total labor force accounted for by individuals with disabilities | In excess of the legally mandated level |
2.55% | ||
| 10 | Gender pay gap (pay for female employees as a percentage of that for male employees) | Figures are not currentry available. KPIs will be set hereafter. |
|||
| Regular employees (indefinite-term, full-time) | 77.5% | ||||
| Non-regular employees (part-time, fixed-term) | 57.0% | ||||
| All employees | 68.5% | ||||
| DIC | Targets (Fiscal year 2030) | ||
|---|---|---|---|
1 |
Percentage of directors and Audit & Supervisory Board members accounted for by women and/or foreign nationals | January 2031 |
30% |
| Percentage of directors and Audit & Supervisory Board members accounted for by women | 30% | ||
2 |
Percentage of executive officers accounted for by woman and foreign nationals nationals | 30% | |
| Percentage of executive officers accounted for by women |
5% | ||
| 3 | Percentage of management positions occupied by women | 12% | |
| 4 | Percentage of new employees accounted for by foreign nationals | Fiscal year 2030 |
5% |
| 5 | Percentage of new recruits accounted for by women | 30% | |
| 6 | Percentage of mid-career hires accounted for by women | 20% | |
| 7 | Percentage of male employees using the Childcare Leave Program | 100% | |
| 8 | Percentage of total labor force accounted for by individuals with disabilities | In excess of the legally mandated level | |
9 |
Gender pay gap
|
Figures are not currently available. KPIs will be set hereafter. | |
Number of Foreign Nationals Currently Employed at DIC
| Sales positions |
Technical positions |
Department/ division administration |
Posted overseas |
Production | Total |
|---|---|---|---|---|---|
| 4 | 37 | 9 | 15 | 3 | 68 |
| Site | Production group | Utility control group |
| Chiba Plant | 8 | 1 |
| Saitama Plant | 9 | 0 |
| Sakai Plant | 3 | 1 |
| Hokuriku Plant | 0 | 2 |
| Yokkaichi Plant | 2 | 0 |
| Total | 22 | 4 |
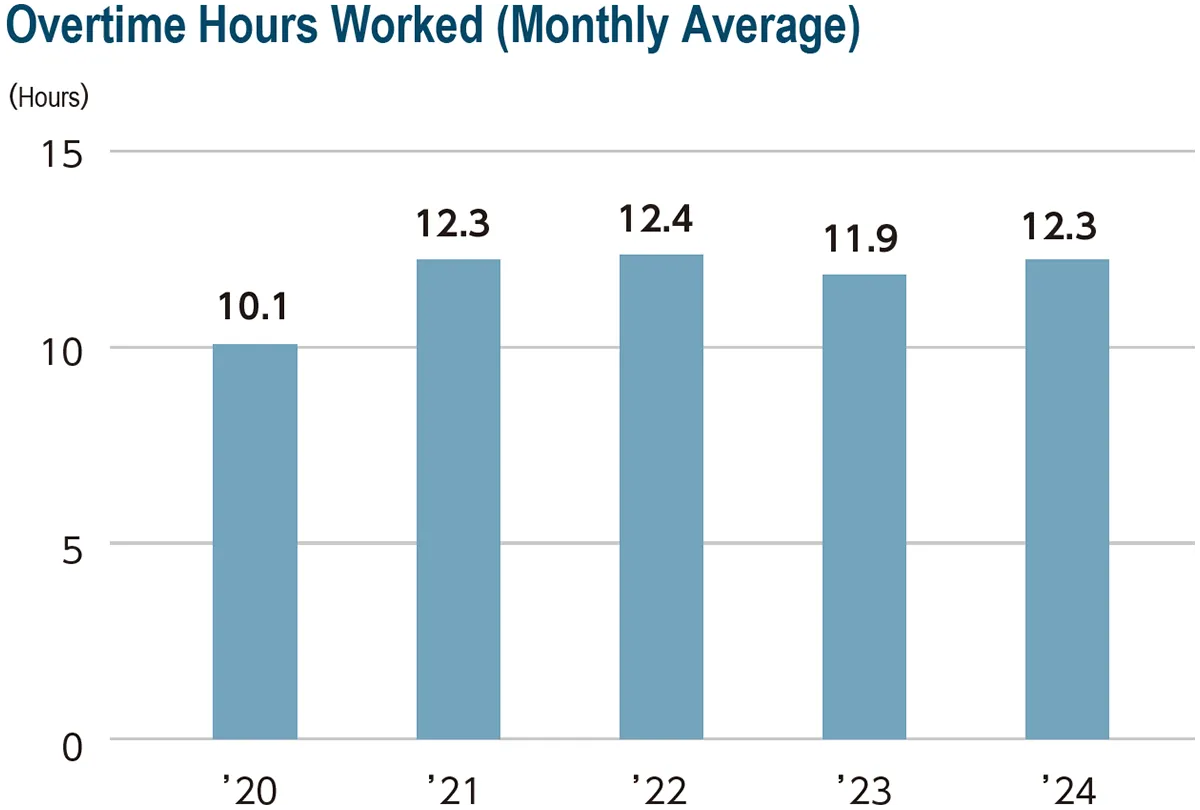
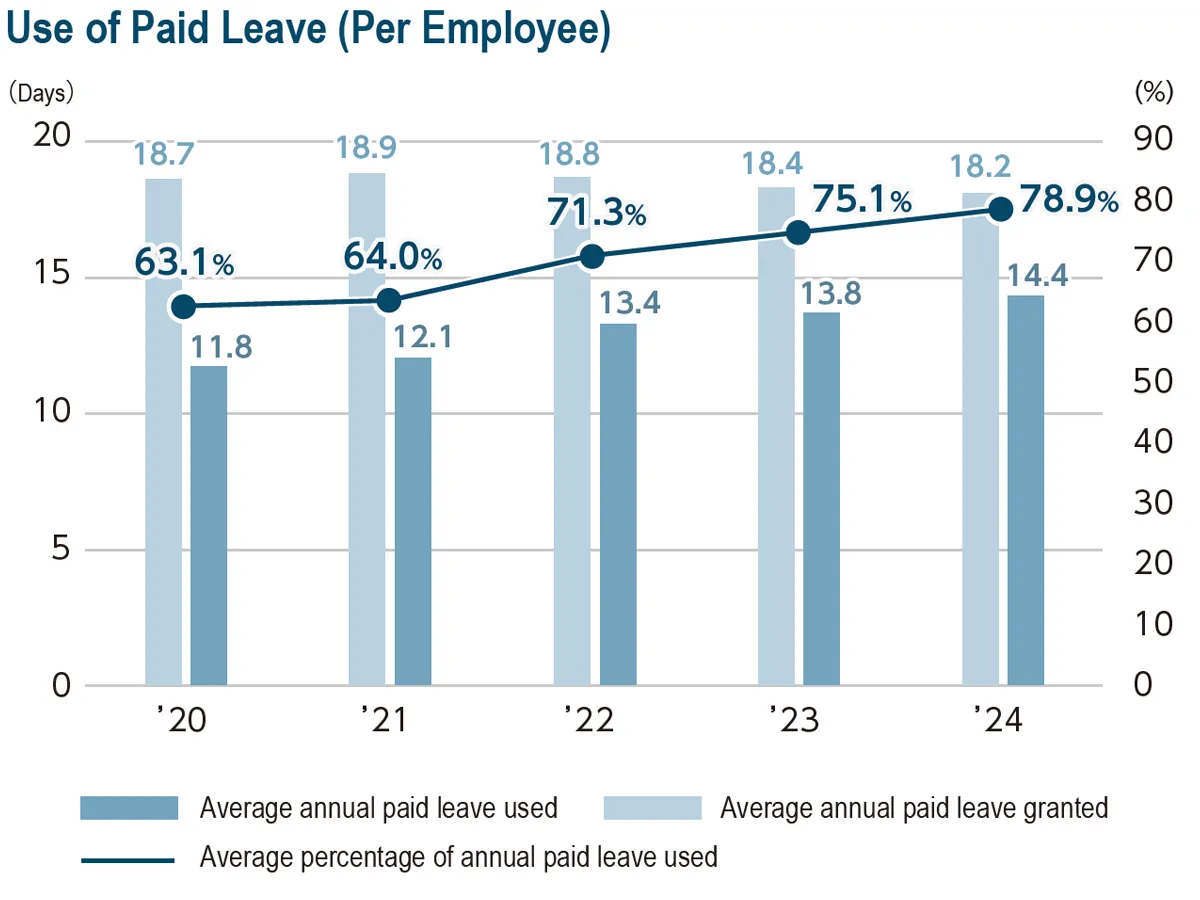
Reducing Extreme Overwork and Encouraging Employees to Take Annual Paid Leave
Outline of ESH Audits in Fiscal Year 2024
| Japan | Overseas | ||||
|---|---|---|---|---|---|
| DIC | DIC Graphics | Other DIC Group companies | Greater China | Asia–Pacific region | Americas and Europe, other |
| 9 sites | 2 sites | 8 sites | 13 sites | 0 sites | 37 sites |
| 19 sites | 50 sites | ||||
Key Data
| Theme | Item | Unit | Boundary | Third-party verification | Fiscal year 2022 | Fiscal year 2023 | Fiscal year 2024 |
|---|---|---|---|---|---|---|---|
Occupational safety and health |
Total recordable incident rate (TRIR) | Persons/million work hours | Japan | ✔ | 2.23 | 2.09 | 1.93 |
| PRC | ✔ | 0.79 | 2.06 | 0.9 | |||
| Asia–Pacific region | ✔ | 1.21 | 1.11 | 1.28 | |||
| Americas and Europe | ✔ | 6.33 | 4.53 | 5.7 | |||
| Global*1 | ✔ | 4.00 | 3.00 | 3.51 | |||
| Frequency rate for occupational accidents resulting in workdays lost | Persons/million work hours | Japan | ✔ | 0.45 | 0.99 | 0.36 | |
| PRC | ✔ | 0.53 | 1.31 | 0.45 | |||
| Asia–Pacific region | ✔ | 0.99 | 0.99 | 1.16 | |||
| Americas and Europe | ✔ | 3.36 | 2.49 | 3.35 | |||
| Global*1 | ✔ | 2.07 | 1.73 | 2 | |||
| Fatalities due to occupational accidents | Persons | Japan | ✔ | 0 | 0 | 0 | |
| PRC | ✔ | 0 | 0 | 0 | |||
| Asia–Pacific region | ✔ | 0 | 0 | 0 | |||
| Americas and Europe | ✔ | 0 | 0 | 0 | |||
| Global*1 | ✔ | 0 | 0 | 0 | |||
| Injuries due to occupational accidents resulting in workdays lost | Persons | Japan | ✔ | 4 | 9 | 3 | |
| PRC | ✔ | 2 | 7 | 2 | |||
| Asia–Pacific region | ✔ | 9 | 9 | 10 | |||
| Americas and Europe | ✔ | 70 | 50 | 67 | |||
| Global*1 | ✔ | 89 | 76 | 83 | |||
| Injuries due to occupational accidents not resulting in workdays lost | Persons | Japan | ✔ | 16 | 10 | 13 | |
| PRC | ✔ | 1 | 4 | 2 | |||
| Asia–Pacific region | ✔ | 2 | 1 | 1 | |||
| Americas and Europe | ✔ | 62 | 41 | 47 | |||
| Global*1 | ✔ | 83 | 56 | 63 | |||
| Disaster prevention | Process safety accidents | Events | Japan | ✔ | 3 | 7 | 12 |
| Frequency of process safety accidents | Events/200,000 work hours | Japan | ✔ | 0.050 | 0.124 | 0.229 |
- Global: Japan, PRC, Asia–Pacific region, Americas and Europe, and other regions
G: Governance data
Meeting Data
Meeting Data
Number of and attendance at meetings of the Board of Directors, Nomination Committee, Remuneration Committee and Corporate Value Improvement Committee in fiscal year 2024
Board of Directors: Number of meetings: 14; attendance: 100% at all but one meeting, which was attended by 13 individuals
Nomination Committee: Number of meetings: 5; attendance: 100%
Remuneration Committee: Number of meetings: 4; attendance: 100%
Corporate Value Improvement Committee: Number of meetings: 8; attendance: 100% at all but one meeting, which was attended by 3 individuals
-

-
Composition of the Board of Directors
In-house Outside Total Percentage of outside members Directors In-house:5 Outside:4 Total:9 Percentage of outside members:44.4% Audit & Supervisory Board members In-house:2 Outside:2 Total:4 Percentage of outside members:50.0% Total In-house:7 Outside:6 Total:13 Percentage of outside members:46.2%
Remuneration for Directors and Audit & Supervisory Board Members in Fiscal Year 2024
| Total remuneration (Millions of yen) | Composition of remuneration (Millions of yen) | Number of directors and Audit & Supervisory Board members | |||
|---|---|---|---|---|---|
| Basic remuneration | Bonuses | Stock compensation | |||
| Directors (excluding outside directors) | 448 | 281 | 93 | 74 | 8 |
| Audit & Supervisory Board members (excluding outside Audit & Supervisory Board members) | 60 | 60 | - | - | 3 |
| Outside officers | 91 | 91 | - | - | 7 |
